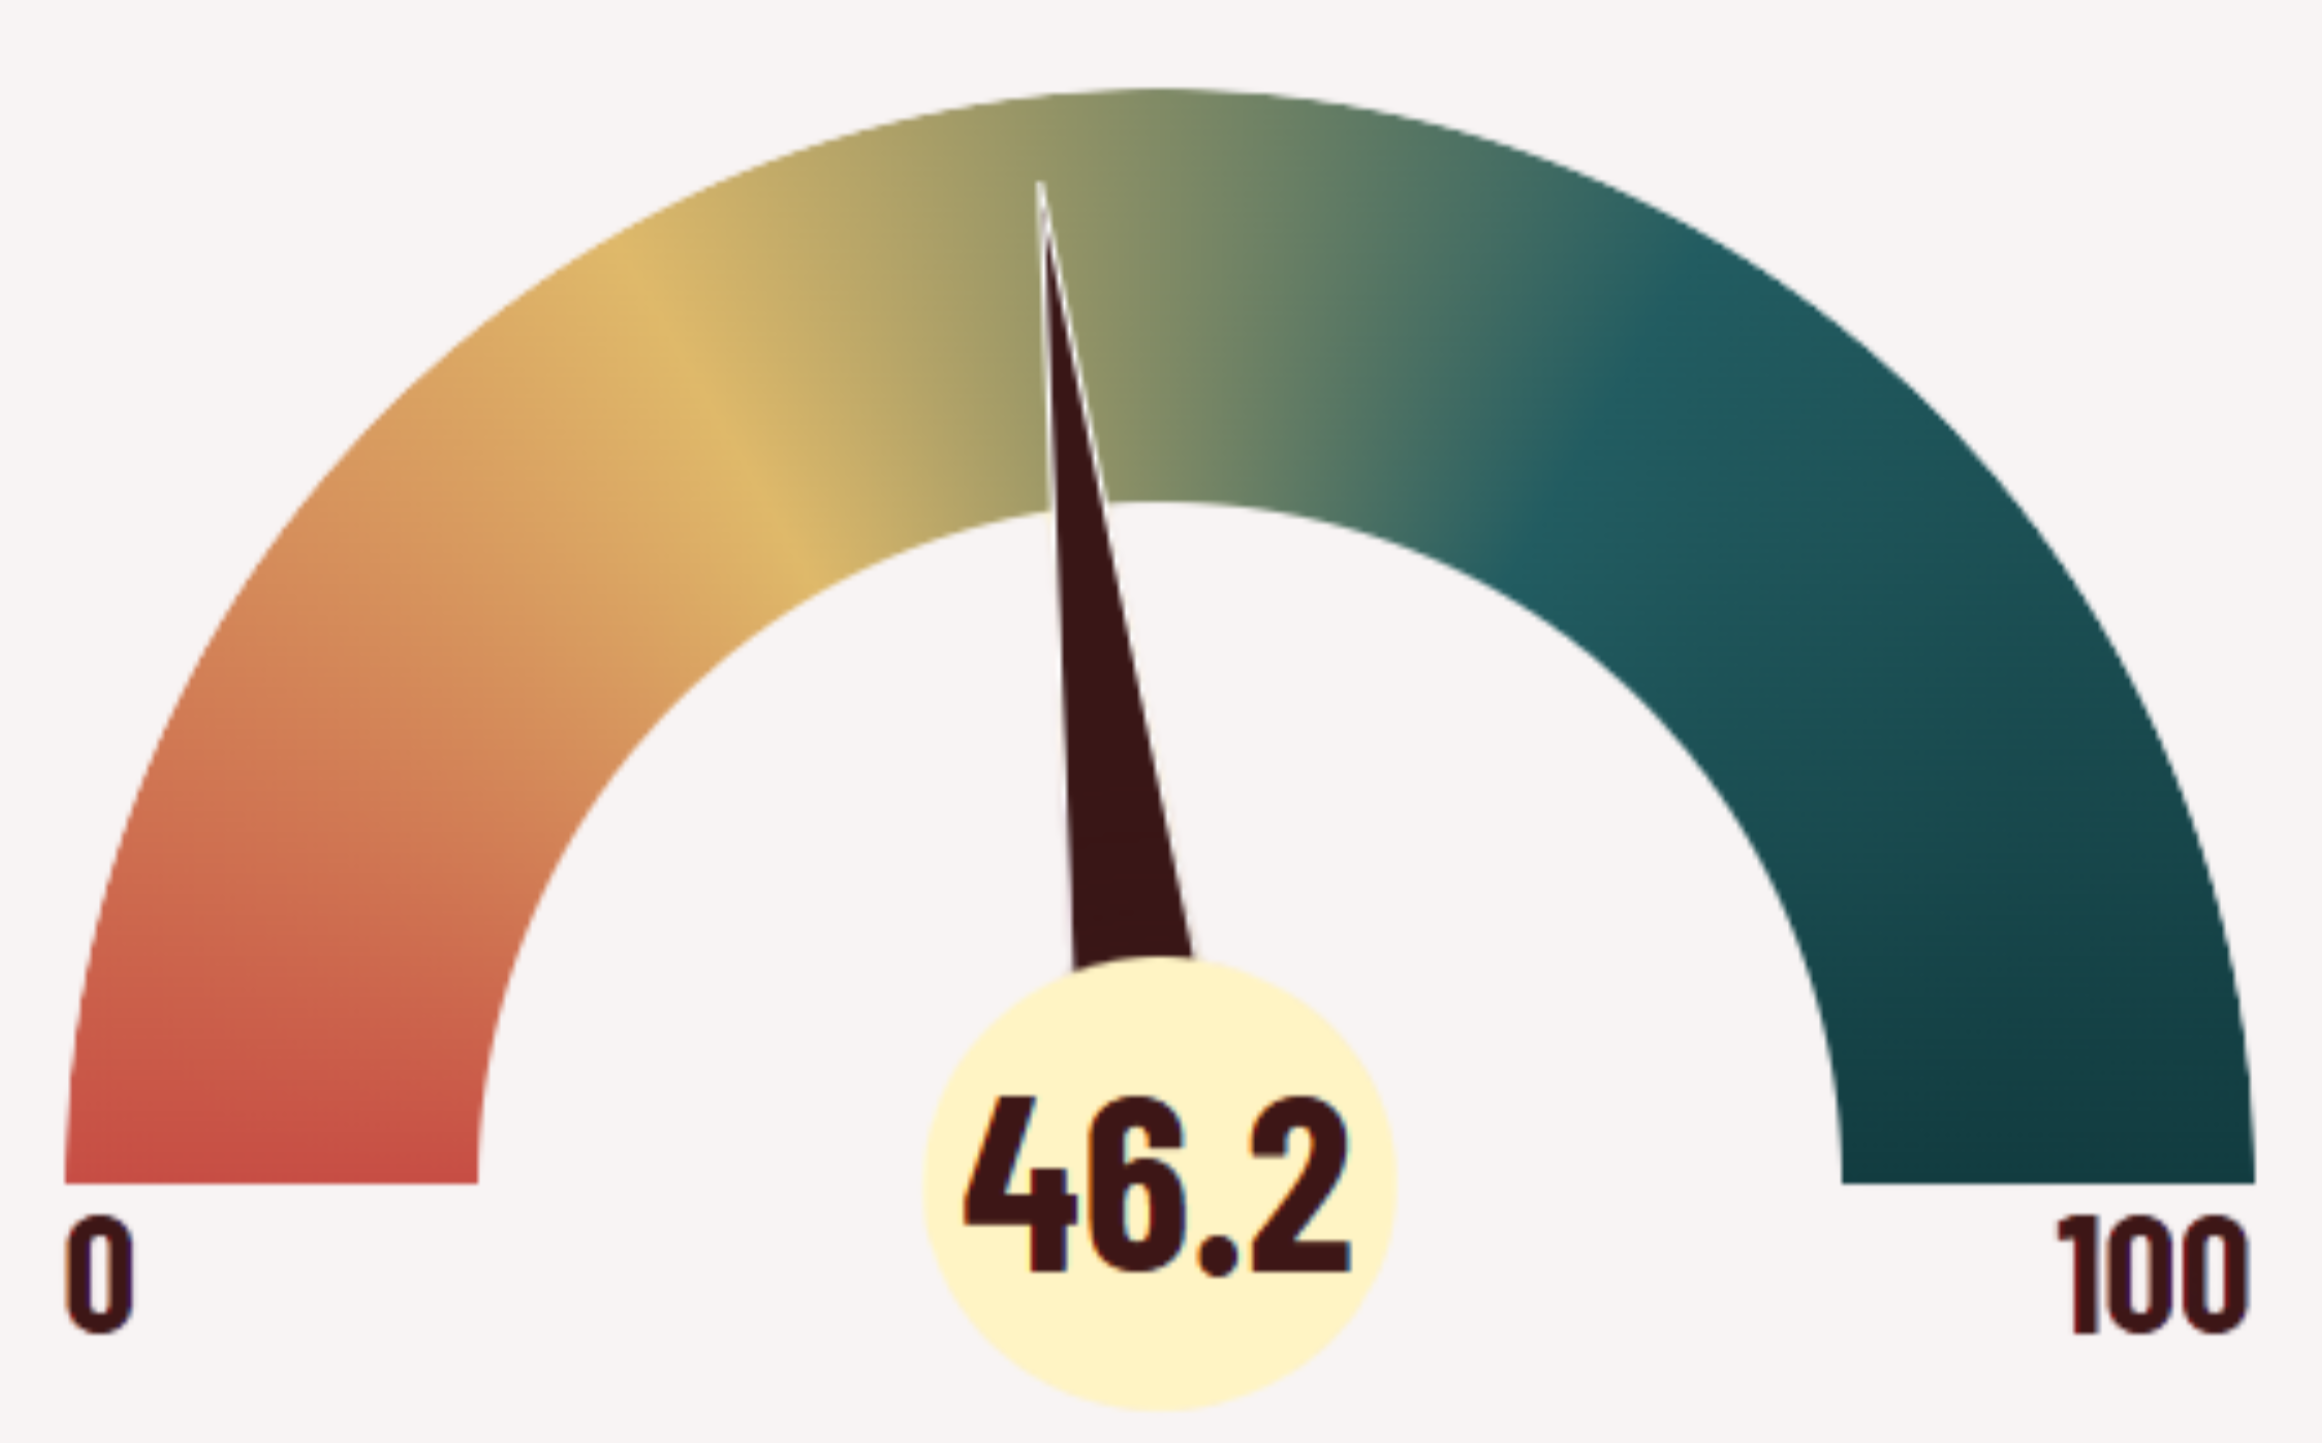
School Score

Proficiencies
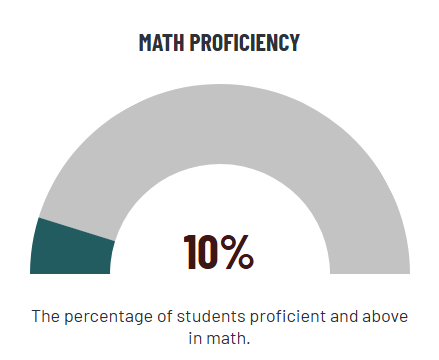
The percentage of students whose ability in math is at the expected level, or higher, for the student's grade.
Students in 3rd through 8th and 11th grade are assessed in math. Students in grades 3-8 take the NM Measures of Student Success & Achievement (NM-MSSA) or Dynamic Learning Maps (DLM). Students in grade 11 take the SAT or DLM.
The math proficiency rate may be adjusted by the number of students who participated in the assessment.
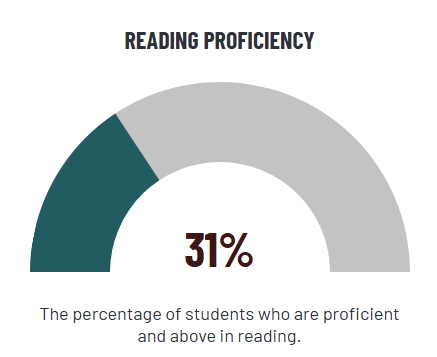
The percentage of students whose ability in reading is at the expected level, or higher, for the student's grade.
Students in 3rd through 8th and 11th grade are assessed in reading. Students in grades 3-8 take the NM Measures of Student Success & Achievement (NM-MSSA) or Dynamic Learning Maps (DLM). Students in grade 11 take the SAT or DLM.
For schools that do not enroll students in grade 3 or higher, students take the Istation ISIP Early Reading assessment.
The reading proficiency rate may be adjusted by the number of students who participated in the assessment.
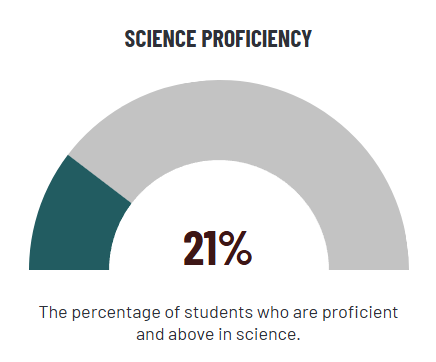
The science proficiency rate measures the percentage of students who are performing at the expected level, or higher, for the student's grade.
Students in grades 5, 8, and 11 are assessed in science. Students take the NM Assessment of Science Readiness (NM-ASR) or Dynamic Learning Maps (DLM).
The science proficiency rate may be adjusted by the number of students who participated in the assessment.
Growth
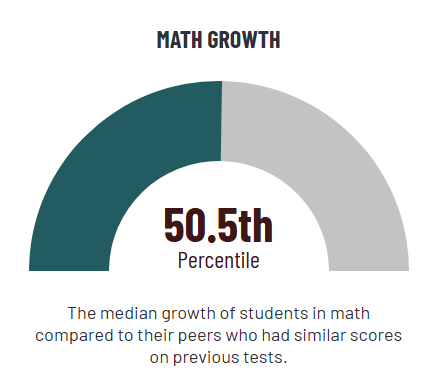
The median growth of students in grades 4-8 in math compared to their peers who had similar scores on previous tests. Percentile ranges from 34-66 represent about a year's growth typical for the academic peer group.
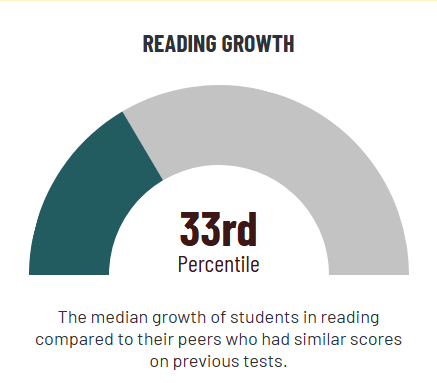
The median growth of students in grades 4-8 in reading compared to their peers who had similar scores on previous tests. Percentile ranges from 34-66 represent about a year's growth typical for the academic peer group.